Geographical-Data-Analysis-of-Poverty-in-Italy-with-R
Results
This section summarizes the main findings of the project Geographical Data Analysis of Poverty in Italy.
The analysis combined descriptive statistics, spatial autocorrelation tests, and spatial regression models (SAR and SAC).
Descriptive Analysis
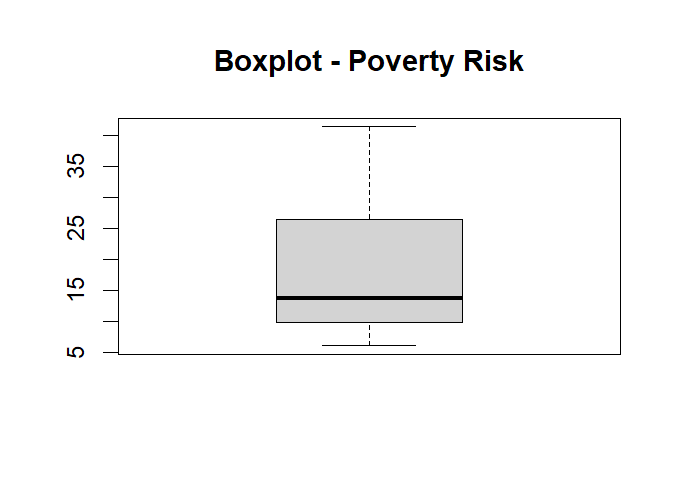
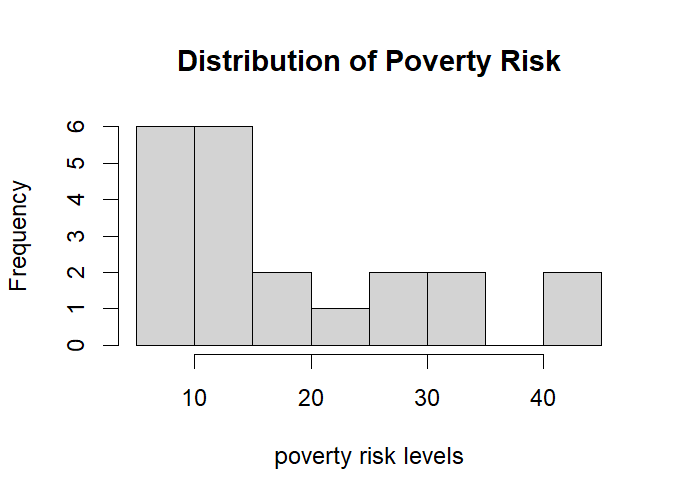
- The distribution of poverty risk across Italian regions shows positive skewness: most regions have relatively low values, but some regions experience very high poverty risk.
- Boxplots and histograms highlight regional disparities and the presence of extreme cases.
Spatial Autocorrelation
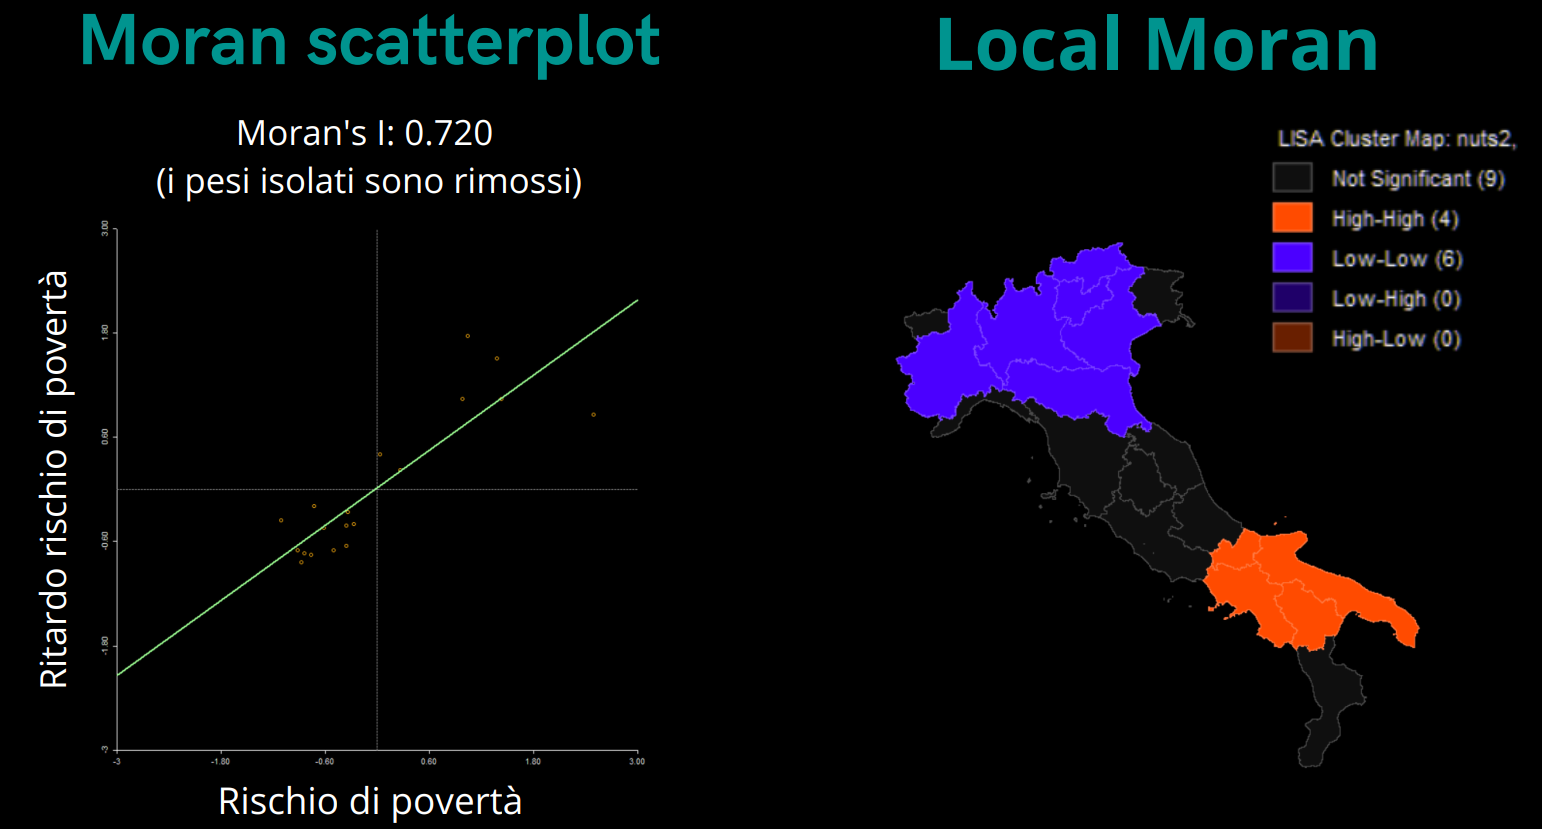
- Moran’s I ≈ 0.72 → indicates strong positive spatial autocorrelation: regions with high poverty risk tend to be surrounded by regions with similar high values, and vice versa.
- Geary’s C confirms positive spatial dependence.
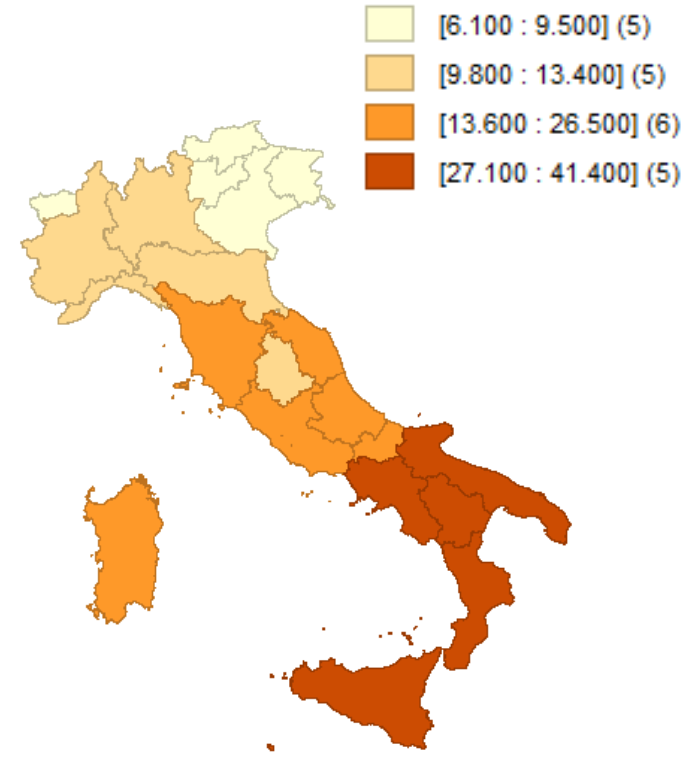
- Local Moran’s I (LISA) identifies:
- High–High clusters in the South of Italy (regions with high poverty surrounded by similar regions)
- Low–Low clusters in the North (regions with low poverty surrounded by similar regions)
- No High–Low or Low–High cases
Spatial Regression Models
- Initial OLS models explained part of the variation in poverty risk but ignored spatial dependence.
- LM tests suggested that spatial models (SAR/SEM/SAC) were more appropriate.
- After comparison:
- SAR model: significant but less effective (higher AIC)
- SAC model: best fit with lowest AIC, capturing both spatial lag and spatial error dependence
Model comparison (AIC):
- SAR ≈ 86.9
- SAC ≈ 81.9 → preferred model
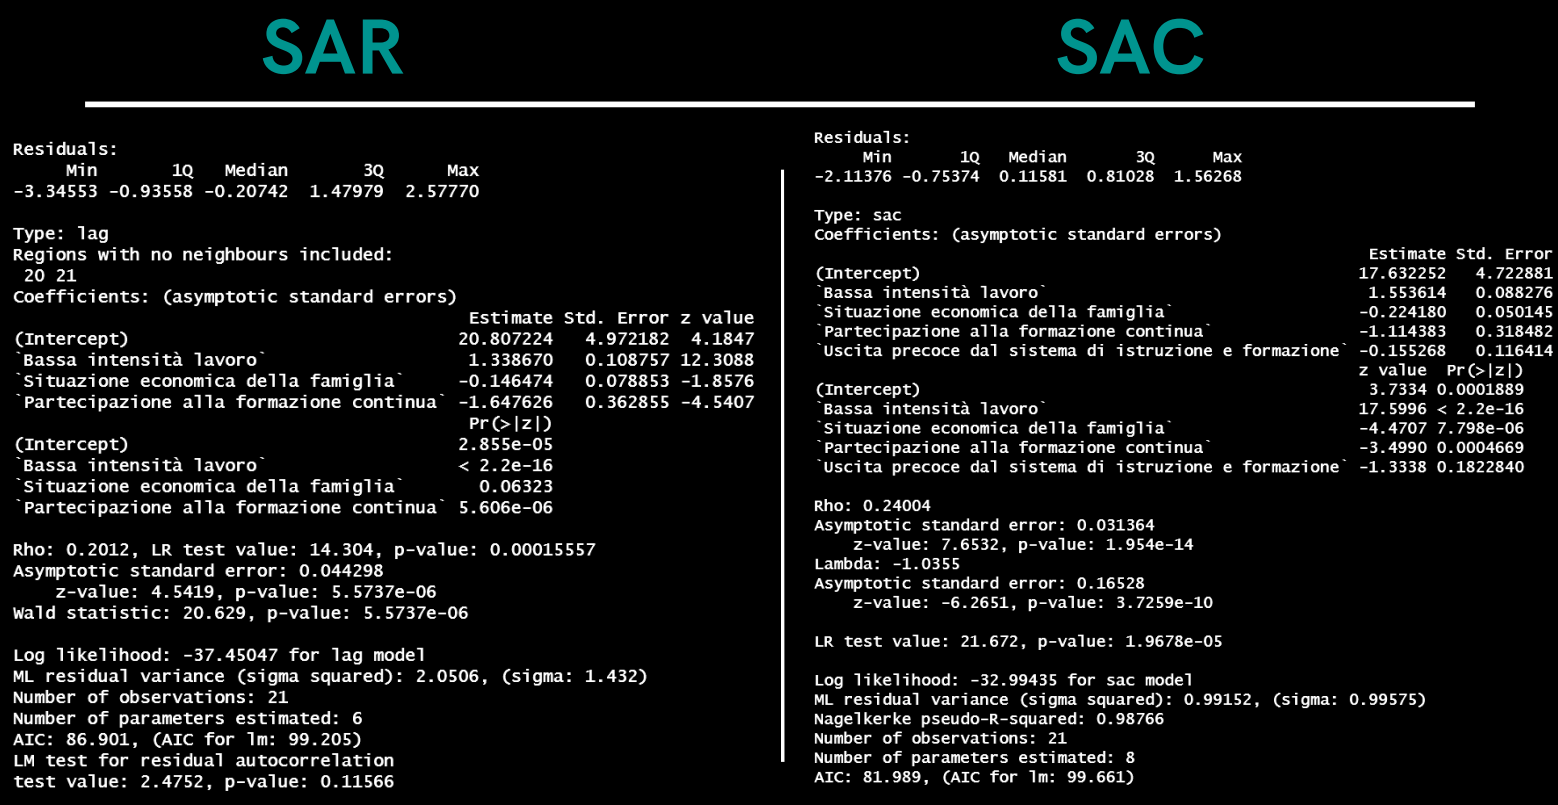
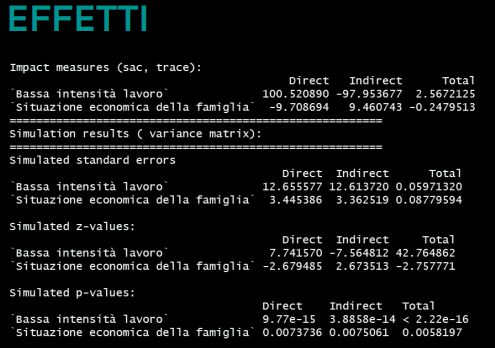
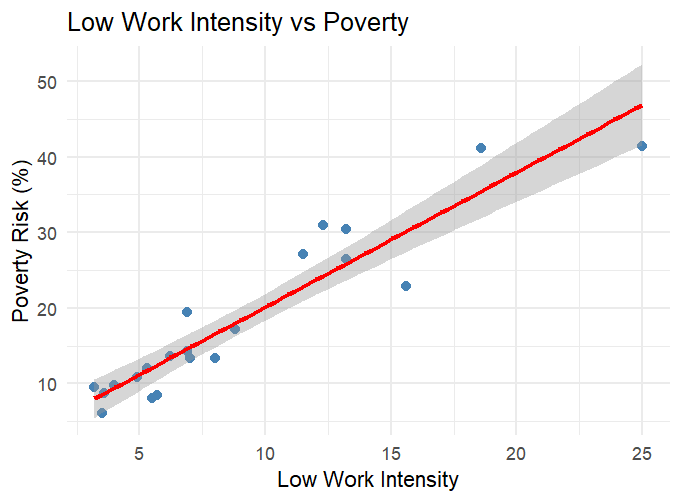
- Direct and indirect effects (from SAC) show that socio-economic factors in one region can have spillover effects on neighboring regions. For example:
- Low work intensity in one region not only increases local poverty risk, but also influences poverty risk in adjacent regions.
Policy Implications
- The strong North–South divide in poverty risk highlights structural inequalities within Italy.
- Spatial dependence suggests that regional policies cannot be isolated: interventions in one region can affect neighboring regions.
- Findings are consistent with EU and national frameworks such as:
- European Pillar of Social Rights (EPSR)
- Italian National Recovery and Resilience Plan (PNRR)
Conclusions
- Objectives achieved:
- ✅ Analyzed poverty risk across Italian regions
- ✅ Studied socio-economic indicators and their influence
- ✅ Verified spatial autocorrelation (Moran’s I, Geary’s C, LISA)
- ✅ Compared OLS and spatial regression models
- ✅ Identified SAC as the best-performing model
- Key insight: Poverty in Italy is not randomly distributed, but spatially clustered. Regional inequalities are reinforced by spatial dependence, requiring coordinated policy measures.